Report 3: How do Greenhouse Gases Cause Global Warming?
Why are feedback loops important?
EXECUTIVE SUMMARY
a.What are the greenhouse gases and how do they
raise atmospheric temperature?
Carbon dioxide is the greenhouse gas of most immediate concern, because it is the most concentrated in the atmosphere and because it can persist for over 100 years in the atmosphere once emitted. On a per molecule basis, other gases can trap even more heat than carbon dioxide.
The overall measure of a gas’s ability to contribute to global warming is called the Global Warming Potential (GWP) which measures the combination of the gas’s ability to trap solar radiation as heat and the length of time it persists in the atmosphere. The GWP of a gas is calculated relative to carbon dioxide's GWP. As the right hand column of the table shows, most other greenhouse gases have far greater GWPs than carbon dioxide.
Human combustion of fossil fuels for energy is the primary source of atmospheric greenhouse gases. More recently, the production of the extremely high-GWP man-made gases has been growing at a much faster rate than carbon dioxide emissions.
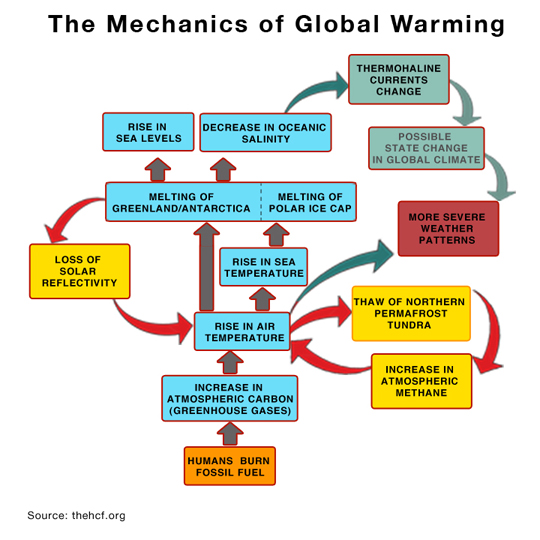
To understand how fossil fuel combustion initiates the mechanisms of global warming, view the center column (blue with gray arrows) in the feedback diagram in Question b below.
b.What are reinforcing feedback loops?
And how do they contribute to climate change?
When you grasp (even initially) the operations of reinforcing feedback loops and the incalculable momentum they contribute to global warming, it is easier to appreciate the severity of the global warming challenge we face.
The diagram at the right shows the primary chain of global warming events in the center vertical stack of blue boxes, starting with fossil fuel emissions at the bottom. The feedback loop on the left (red arrows) is when polar and Greenland ice sheets melt and the earth loses their valuable solar reflectivity. On the right (red arrows) is the feedback loop when frozen arctic tundra thaws and releases methane, an extremely potent greenhouse gas.
c.Where is the warming of the earth the worst?

Unfortunately, the greatest warming of the air and sea is occurring in the far northern latitudes where the reinforcing feedback loops are initiated. See chart on right.
The chart shows the temperature variation in 2005 from the 1951 to 1980 average.
Far northern latitudes where the reinforcing feedback loops originate are as much as 6 degrees F warmer than 100 years ago.
d.What are the sources of greenhouse gases?
There are three primary anthropogenic (human caused) contributors to rising greenhouse gas concentrations.
The first is our excessive burning of fossil fuels for energy.
The second is our accelerating removal of the earth's natural carbon storage through our destruction of forests and our removal of previously vegetative land for habitat, grazing, and agriculture for livestock production.
The third is the release of extremely potent (high-GWP) man-made greenhouse gases through various manufacturing processes.
FULL REPORT
a.What are the greenhouse gases and how do they
raise atmospheric temperature?
Humankind emits both natural and man-made gases into the atmosphere. Gases that hold solar radiation as heat are called greenhouse gases. The vast majority of the greenhouse gases in the earth’s atmosphere have come from the combustion of fossil fuels to power our cars and generate our electricity. The central column of the flow chart in Question b below depicts the various steps in the global warming chain starting with the combustion of fossil fuel.
Carbon dioxide is the most concentrated greenhouse gas (other than water vapor) in the earth’s atmosphere, but it is also the weakest gas in terms of heat trapping ability. Once released into the atmosphere, greenhouse gases eventually disintegrate by natural processes. The average time to disintegrate can be as short as 12 years, for methane, or greater than 50,000 years, for the essentially permanent perfluoromethane. What makes carbon dioxide so dangerous is that it is the most prevalent of the greenhouse gases and, once released into the atmosphere, it persists on average for 100 years or more.
The table at the right shows five prominent greenhouse gases. For each of the five gases listed, the historical and recent atmospheric concentrations and the atmospheric lifetime (in years) is shown. Also note that the right-hand column presents the Global Warming Potential (GWP) for each gas. The GWP expresses the overall warming danger of the gas compared to carbon dioxide by incorporating both the ability of the gas to hold solar radiation as heat and the atmospheric life of the gas. Notice that relative to carbon dioxide, each of the other four gases shown has a much higher GWP, ranging from 21 times greater than carbon to over 22,000 times greater. These large GWPs show that carbon dioxide is not the only greenhouse gas of concern. All of the greenhouse gases, because of their large GWPs, represent a real threat to global warming, even in relatively small concentrations.
The case of methane deserves special mention for two reasons. First, methane, or natural gas, is used extensively in heating buildings in the USA. Unfortunately, the pipeline delivery system for methane is old and notoriously leaky. As such, significant amounts of methane are wasted each year as it leaks into the atmosphere before it reaches our homes and offices. Second, vast amounts of methane are currently trapped under the perma-frozen tundra of the northern latitudes. As the air temperature rises in the northern latitudes and the perma-frozen tundra thaws, methane will begin to be released into the atmosphere, potentially in vast quantities.
Greenhouse Effect
BBC News (animation)
American Global Warming Gas Emissions Accelerate To a Record High
The Guardian
b.What are the greenhouse gases and how do they
raise atmospheric temperature?
When you understand (even initially) the operations of reinforcing feedback loops and the incalculable momentum they contribute to global warming, it is easier to appreciate the severity of the global warming challenge we face.
The diagram at the right shows the primary chain of global warming events in the center column starting with fossil fuel emissions at the bottom. The two primary feedback loops are shown in red on the sides. On the left is the feedback loop that results when polar or Greenland ice sheets melt and the earth loses important solar reflectivity that the ice sheets provide. On the right is the feedback loop that results when the northern permafrost tundra thaws and releases vast amounts of stored methane, which is over 20 times more dangerous to global warming than CO2. Also shown on the top right are the linkages, from rising air temperatures and changes in the thermohaline circulation currents in the oceans, that may likely lead to more severe storm patterns for many parts of the globe.
To illustrate one example: as the temperature rises, the polar and Greenland ice sheets melt and as these white surfaces melt, less sunlight (heat energy) is reflected back into space, resulting in even greater temperature rises on the earth's surface. Consider that seemingly small atmospheric temperature changes are naturally flowing through reinforcing feedback loops, which are then further accelerating global warming.
c.Where is the warming of the earth the worst?
Unfortunately, the greatest warming of the air and sea is occurring in the far northern latitudes where the reinforcing feedback loops are initiated. The colored chart from NASA on the right depicts the variance from the 1951 to 1980 average. The warmest variances from 1.5 to 3.4 degrees C are shown in red and maroon and cover all of the far northern latitudes (north of 75 degrees). It is important to note that in this chart the temperature variance is started in degrees C over a fairly recent period (1951 to 1980). Thus, when compared to the early 1900s, the far northern latitude temperatures are as much as 6 degrees F greater. As mentioned above, the two primary reinforcing feedback loops that exacerbate global warming
(ice sheet melt and tundra thaw) both operate in the far northern latitudes.
When you consider both the reinforcing feedback loops and the temperature variation distribution, you get a discomforting sense of the magnitude of the momentum that may already be driving us toward greater global warming. As we continue to burn fossil fuels and cut down our forests (which are carbon storage facilities) we both add directly to global warming and accelerate the reinforcing feedback loops.
NASA 2005 Global Temperature Report
d.What are the sources of greenhouse gases?
There are three primary anthropogenic (human caused) contributors to rising greenhouse gas concentrations: (1) our excessive burning of fossil fuels for energy, (2) our accelerating removal of the earth's natural carbon storage through our destruction of forests and our removal of previously vegetative land for habitat, grazing, and agriculture for livestock production and (3) our various manufacturing processes which release near-permanent and extremely potent man-made greenhouse gases. Few of us appreciate how the many things we do, the things we consume, or the things we buy, generate greenhouse gases directly or indirectly in their own production.
Greenhouse Gases
EIA
WHAT YOU CAN’T SEE WILL HURT YOU
Editorial by Hal Hinkle
If you saw somebody you respected repeatedly doing something bad to themselves or their family, you probably would ask yourself, “Can’t they see what they are doing?” Not seeing that we are “doing it” may be the biggest impediment to individual change relative to protecting our atmosphere and environment. Remember when you last saw an older model diesel truck spewing out visible exhaust? Did you mutter something like, “Oh, how disgusting!”? If cars still produced visible emissions, then with each use we’d be reminded of what we were doing. If the fuels we burn were solid and had to be loaded into our cars or brought into our homes by hand (like groceries), instead of flowing, unseen, through pump hoses or power lines, we’d have a physical reminder of the amount of the fuel we are using each time we refueled our cars or houses. If our fuel emissions from our cars, homes and offices were solid like trash instead of gaseous, then each time we had to clean out the emission tank of the car or take out the emission can from the house, we’d know the volume of emissions we produced and needed to discard someplace.
Unfortunately, we don’t experience first hand the 5,000 lbs of carbon we put into an average car as fuel annually, since gasoline flows into the tank invisibly. And we don’t see the main output of the combustion (greenhouse gases) leave our car's tailpipes. But we are smarter than that. The scientific community has unanimously sounded the alarm. We now know what we are doing. We know that what we can’t see is hurting us, and those who come after us. We have to choose to change based on what we know not what we can see. Often it is easy to change when external leadership urges us to do so. That is a luxury we sadly may not have. Time is another luxury we don’t have.
– Hal